How has El Niño influenced summer temperature and precipitation around the world? How often have El Niño summers been warmer than average versus cooler than average?
Since the National Oceanic and Atmospheric Administration (NOAA) officially declared the onset of El Niño in June 2023, there’s been growing interest in how this phenomenon influences summer temperatures and precipitation worldwide. While the effects on summer climate in the United States are minimal, the impact is more pronounced in other parts of the world.
RELEVANT SUSTAINABLE GOALS


El Niño and the Tropics: Hotter and Drier Summers
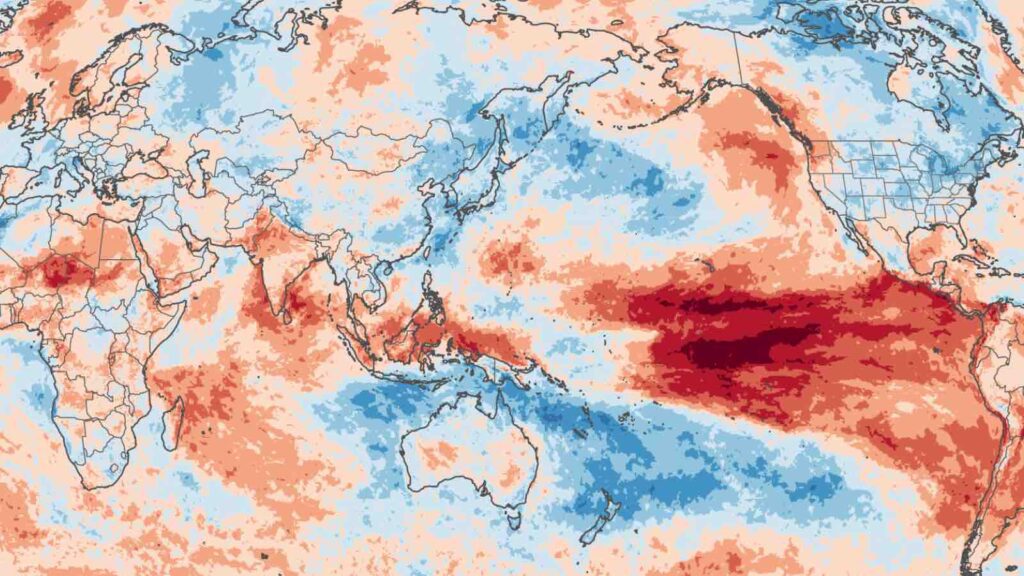
In regions like northern Africa, India, and Central and South America, Northern Hemisphere summers leading up to El Niño winters tend to be warmer and drier than average. These climatic changes during El Niño summers have been consistently recorded since 1950.
Brian Brettschneider, a climate expert with the National Weather Service-Alaska, conducted an analysis of the 29 El Niño summers on record from 1950 to the present. For this study, an “El Niño summer” is defined as any summer preceding a winter with El Niño conditions, regardless of El Niño’s official status during the summer.
El Niño and the Tropics: Hotter and Drier Summers
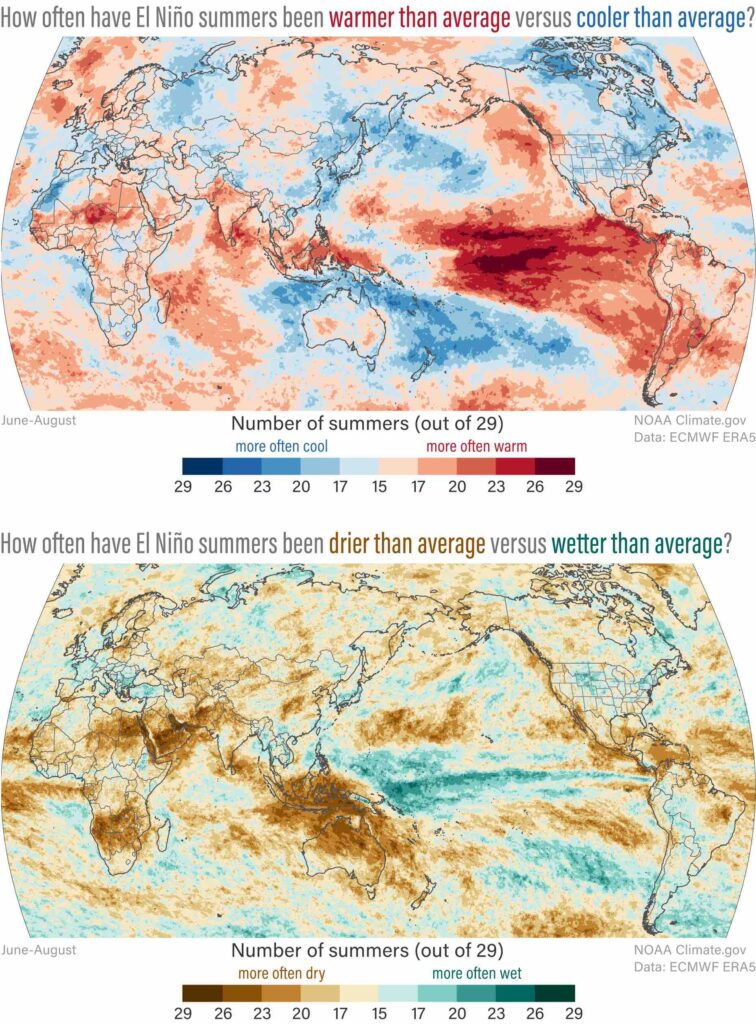
Two maps illustrate the frequency of these climate anomalies during El Niño summers. The top map shows areas where hot summers were more common than cold ones (red) and vice versa (blue). The bottom map contrasts regions with predominantly dry summers (brown) against those with wet summers (green). The darker the color, the more consistent the climate anomaly, rather than its intensity.
The tropical Pacific, the epicenter of El Niño, almost always experiences hotter-than-average temperatures during these summers. This pattern also extends to regions as diverse as the African Sahel and Hawaii, where approximately 70 percent of El Niño summers were warmer than average. These conditions often lead to increased risks of drought and fires in areas like the Amazon Rainforest and Indonesia.
In the United States, cooler-than-average El Niño summers slightly outnumber hot ones in most parts, with notable exceptions in the Pacific Northwest and Alaska, where the opposite trend is observed. The Great Lakes region exhibits a significant tendency towards cooler summers during El Niño years.
Technical Details: The Science Behind the Maps
The data for these maps comes from a technique called “reanalysis,” which uses climate models to fill gaps in historical observations. The maps are based on the “ERA5” reanalysis from the European Center on Medium-range Weather Forecasting, covering global climate data since January 1940.
Brettschneider’s choice to focus on summers preceding winter El Niños captures the strengthening phase of El Niño, offering a clearer picture of its impact on summer climates compared to considering summers when El Niño conditions are already present.
El Niño’s influence on summer climate varies significantly across the globe, with substantial impacts in certain tropical regions. Understanding these patterns is crucial for preparing for and mitigating the effects of this climatic phenomenon. We invite you to join the discussion on social media and share your observations and insights on El Niño’s impact.
You may also be interested in :
The Hidden Cost of Climate Change : A $16 Million Per Hour Global Price Tag, Study


